Project Summary: Analysis of Global Weather using the OpenWeatherMap API
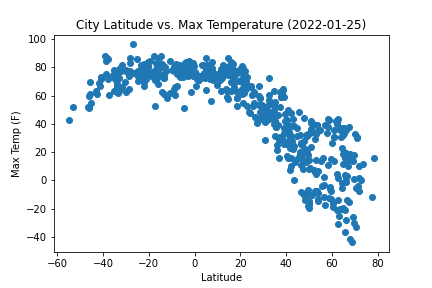
This project analyzed how weather patterns change as you get closer to the equator.
Data was obtained in Janaury 2022, using the OpenWeatherMaps APIs. Over 500 cities from
across the globe were randomly selected for analysis. The source data can be found on this site on the
Data page.
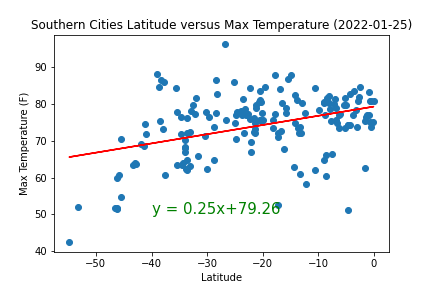
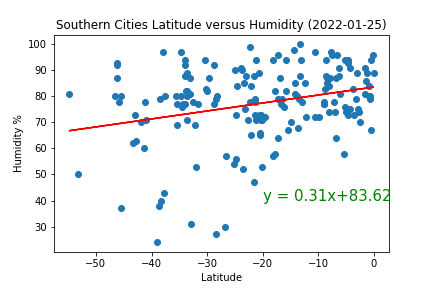
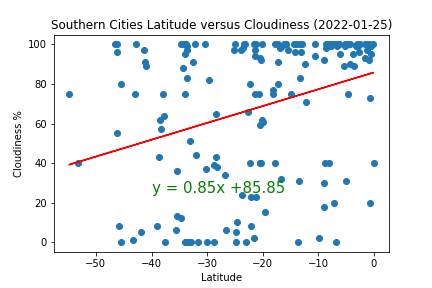
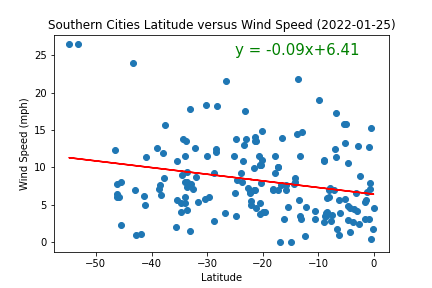
After acquiring the data, I used the Matplotlib package to visualize different weather patterns versus
latitude.
You can find my obsrevations for all of these weather trends on the Comparisons page.
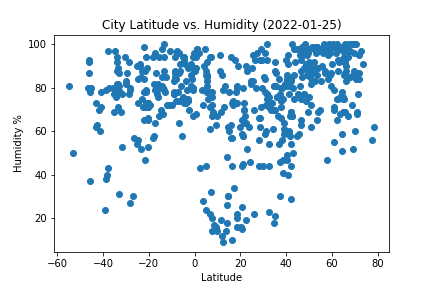
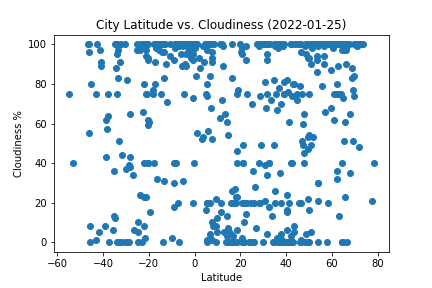
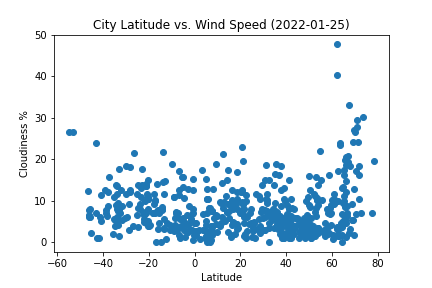
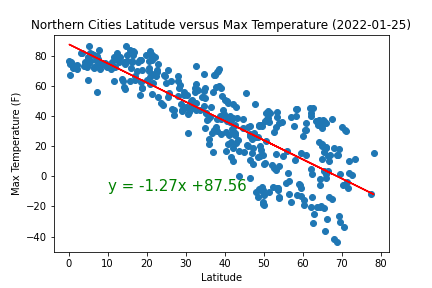
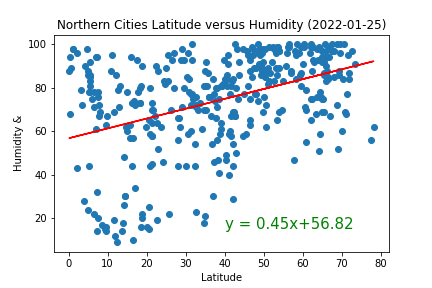
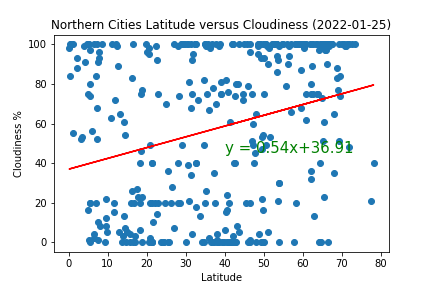
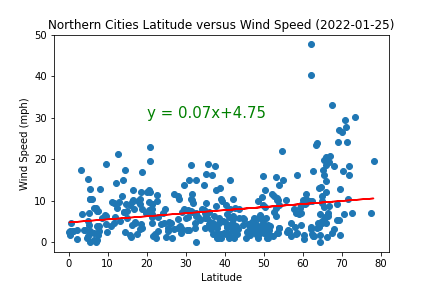
The following weather patterns were explored: temperature, humidity, cloudiness, and windspeed.
Theses patterns were assessed at the global level as well as more granularly between the northern and
southern hemisphere.
See Plots and North versus South for more detail.
Visualizations of my findings and dexiptions of observed trends and correlations (or lack thereof) are
also on this site.
Enjoy the findings!
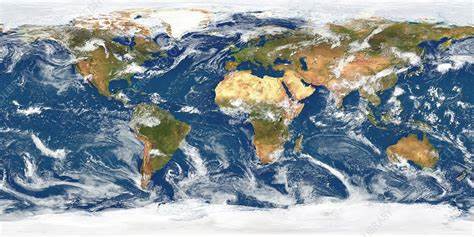
Global Weather Visualizations
Northern Weather Visualizations
Southern Weather Visualizations
